
Error distribution table
Hey speeders! In today's article we will understand how to interpret the Errors Distribution table in the DART Climbing App!

The Errors distribution table helps us to understand what we should prioritize in our technical work and what remains secondary and can be worked later in time.
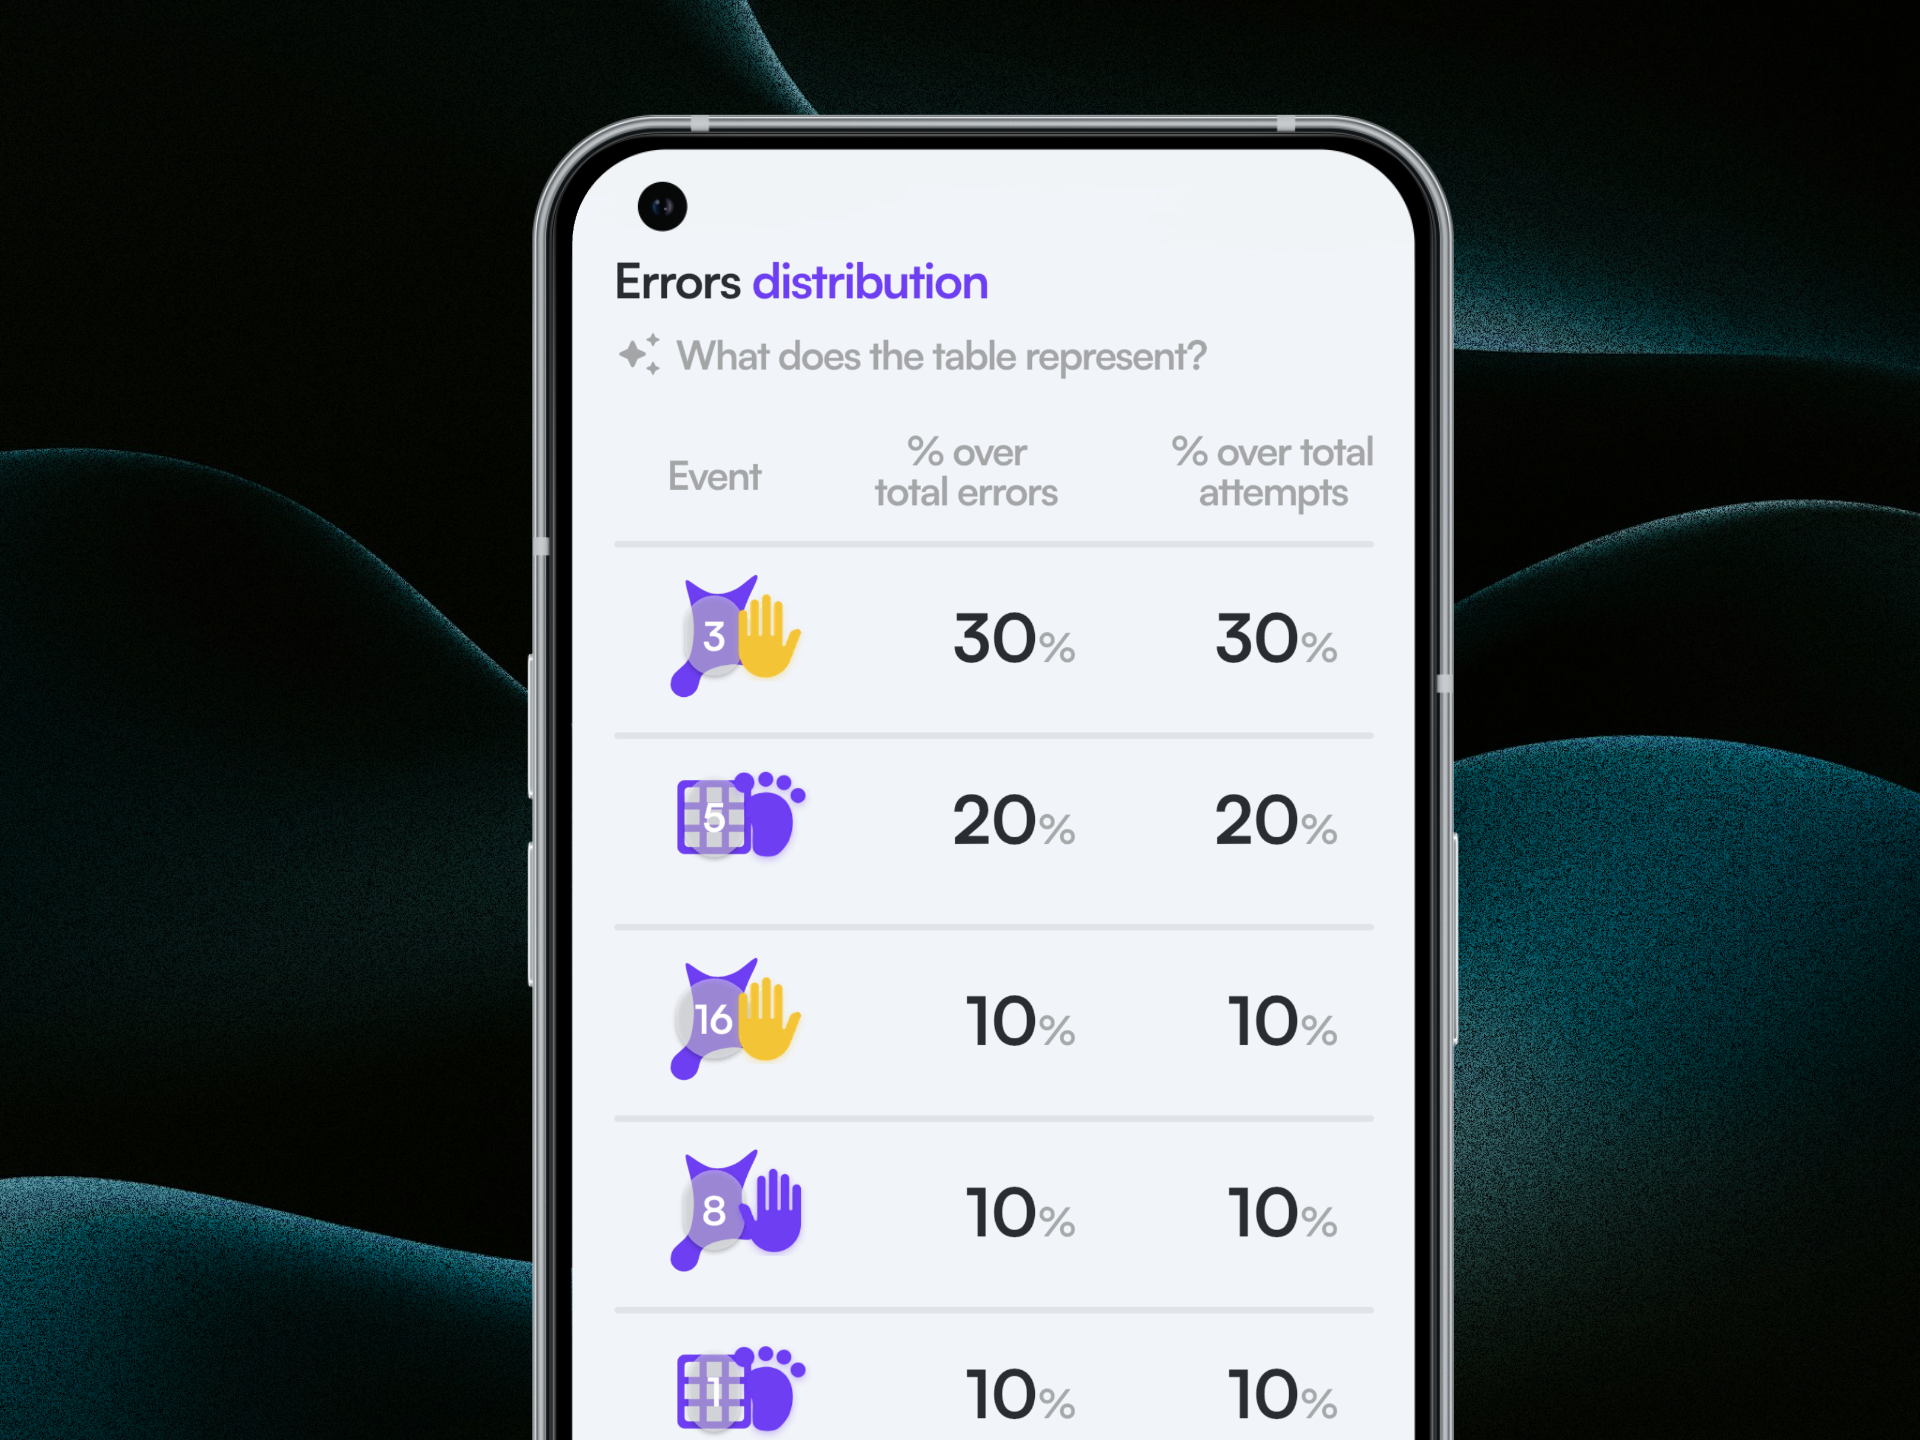
So starting from left to right we find:
- The Hold number and the limb that are linked to the errors
- In the middle we find the distribution of that error connected to the total number of errors
- On the right we find how many times we make that error over the total number of runs we made
And you will ask, are the stats the same or not?
Not exactly, the first metric gives you a precise quantification of the prevalence of that specific error compared to the total number of errors, for sure if you always make many mistakes, even an important one can have only a small percentage over the total number of errors.
The formula calculates the relative frequency, expressed as a percentage, of a specific type of error within the total set of recorded errors.
Es represent the total count of a specific error type
Et represent the total count of all error types observed.
The percentage P is computed as:
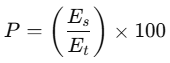
This formula provides a normalized measure, allowing for the comparison of different types of errors.
The other way around if you are very precise, an error can result in an high percentage over the total number of errors.
The last metric gives us an idea of how many runs we "miss" due to that specific error, if you are very precise, that percentage will be lower, if you're not very precise, that percentage will be high and probably near the percentage of the errors.
The formula calculates the relative frequency, expressed as a percentage, of a specific type of error within the total number of runs.
Let:
- Es = Total count of a specific error type
- R = Total number of runs observed
The percentage P is computed as:
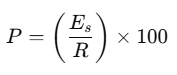
This formula provides a normalized measure, allowing for the comparison of error occurrences relative to the number of runs, independently of the total number of errors.

With all that knowledge, you can know if you need more overall consistency or if you just need to focus on few details to get better!
And now! Go and analyze your stats to understand where you need to work most and how much precise you are.
See you in the next article!