
Efficiency time
Deep dive guide into this table

Do you want to do only perfect runs without errors? Do you know which speed is the best for you to do technical work?
With that table you can answer to both of these questions!
The Efficiency time table relates two metrics to give you an insight about which speed is the most efficient for you specifically.
So starting from the best time of the session, that gives us a reference about our daily shape, we monitor the number of errors made in every session to let you know what a better shape means for you.
Are you performing your best when you are well rested and in the best shape possible, or is it too much power to handle?
With that metric you can know it in detail and manage your trainings based on your daily shape and your goals!
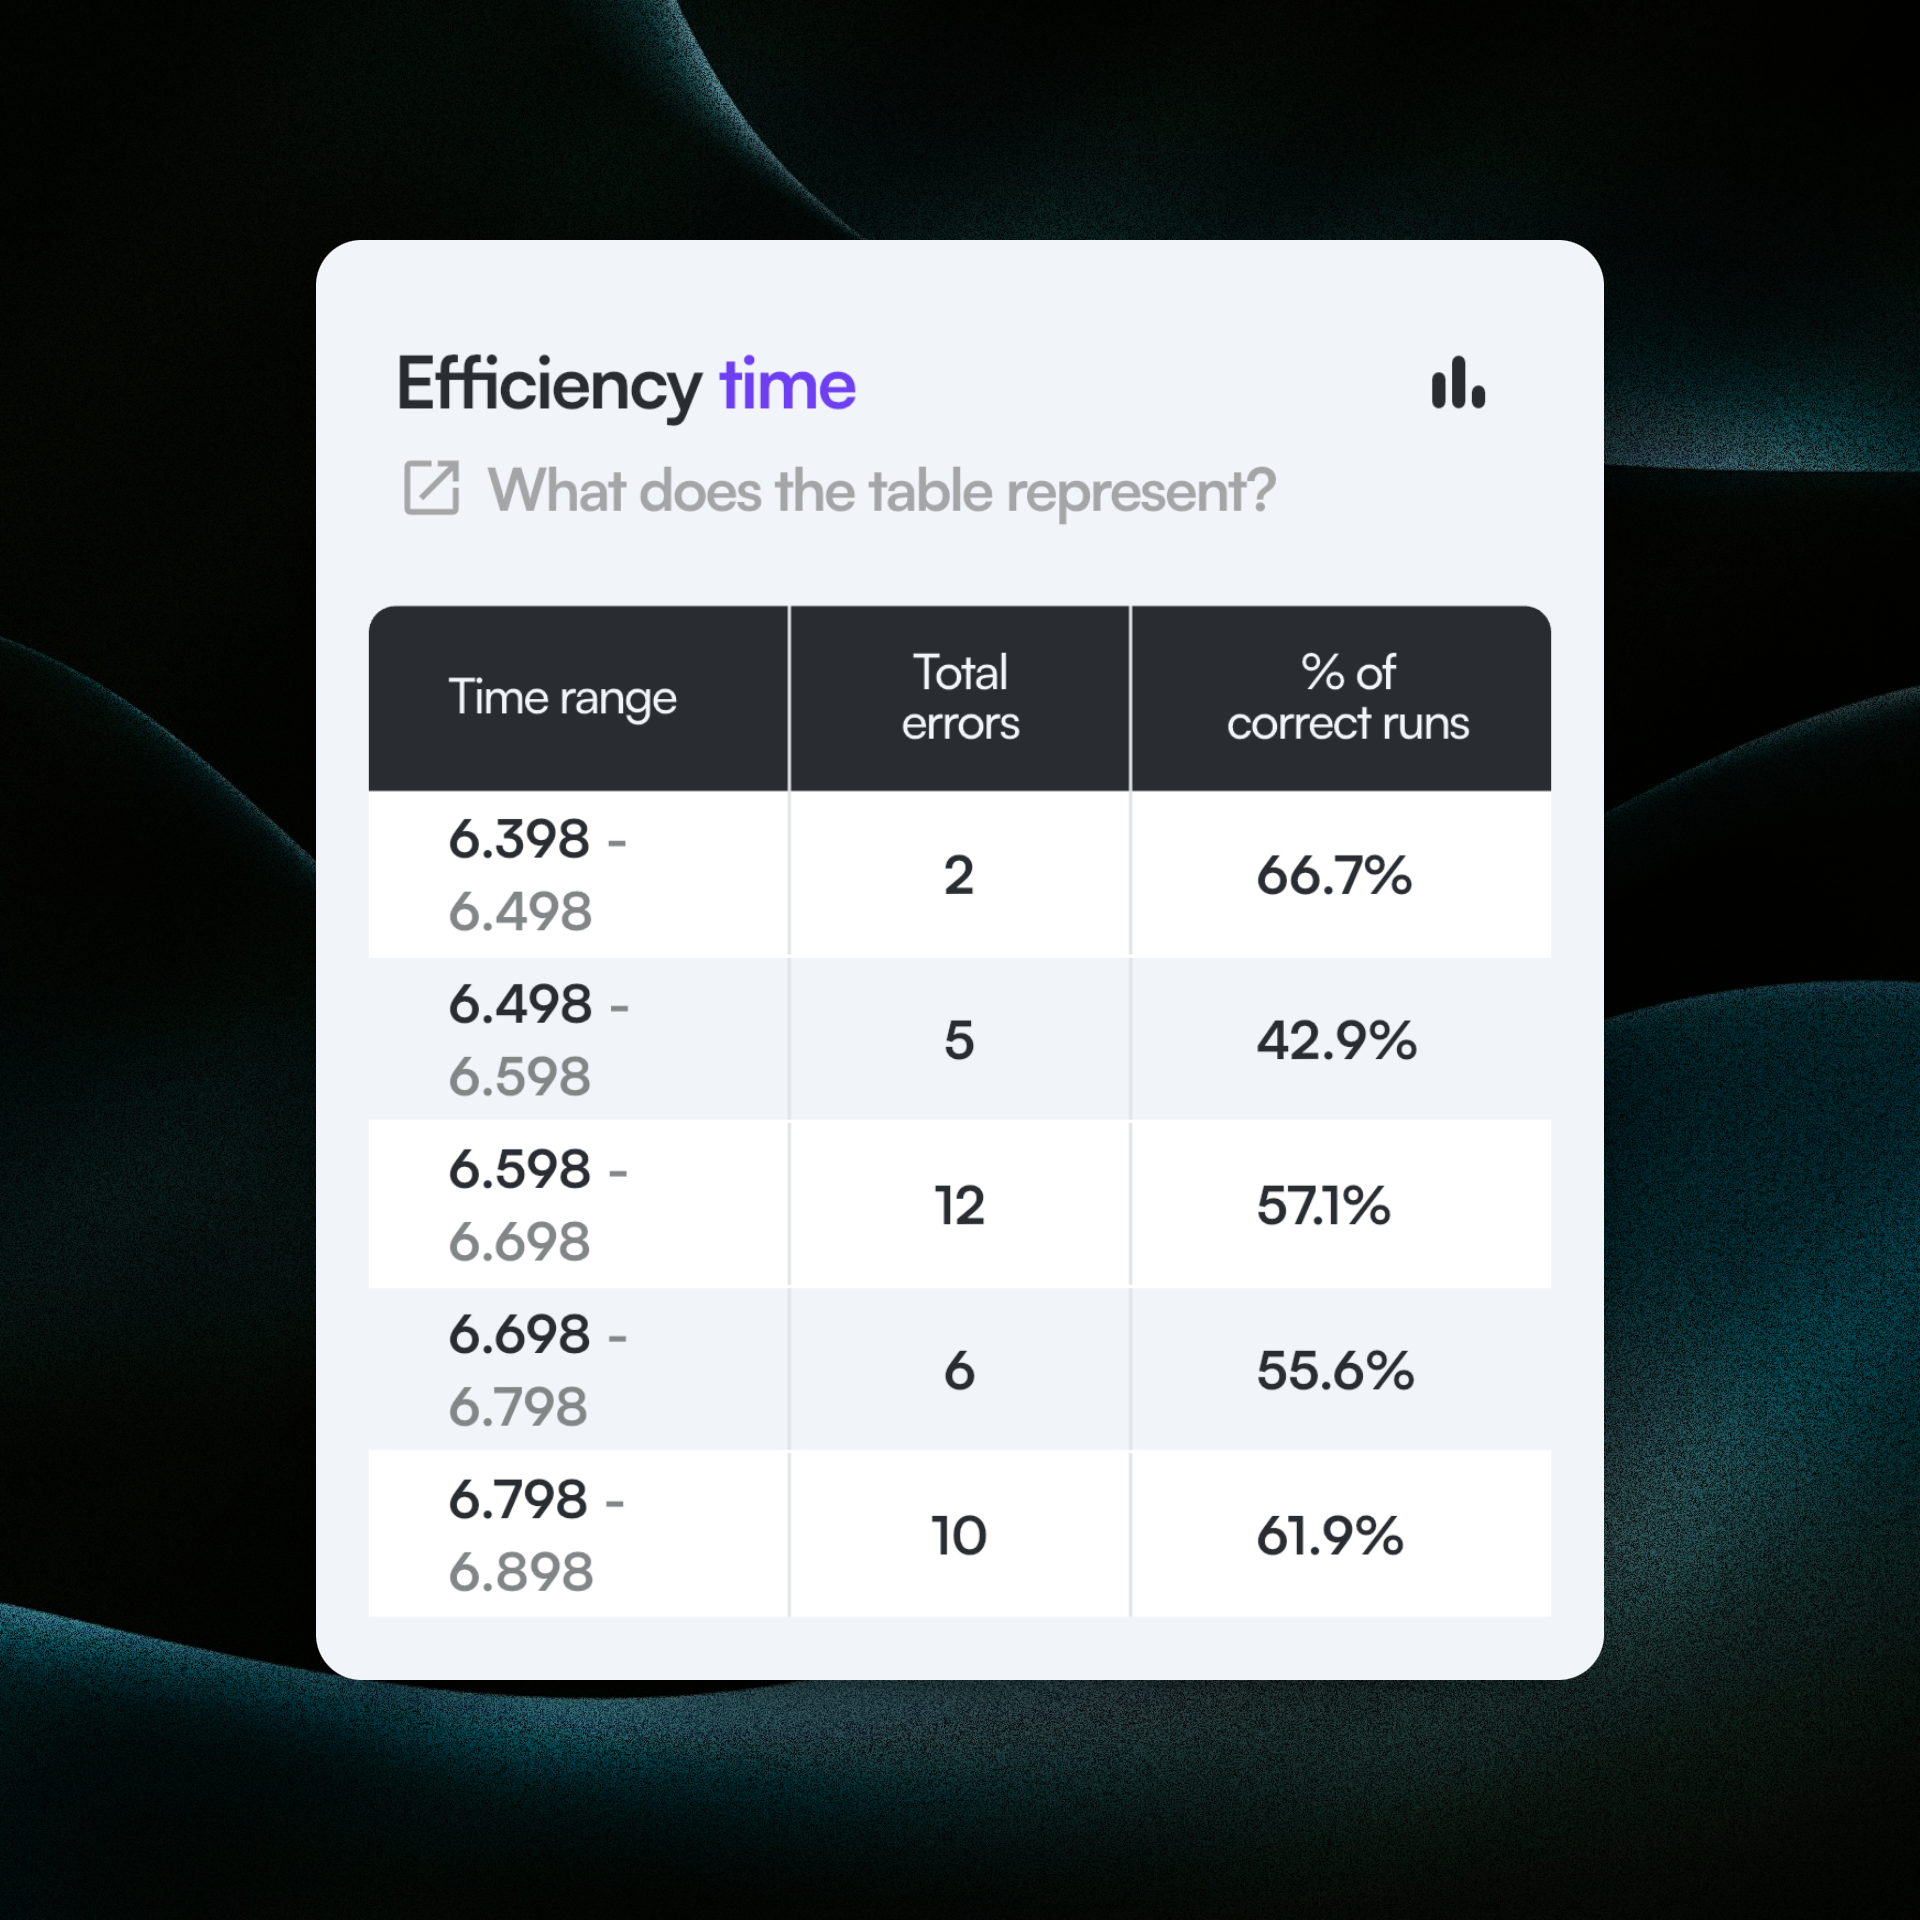
Here an example:
You can see that as you are closer to your PB you tend to make more mistakes, but just 2 tenths of seconds more and you are super consistent! WOW, now you know at which speed you perform best and how to manage your runs to be as efficient as possible!
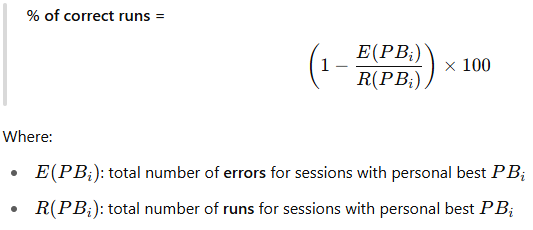
The formula we use to calculate the errors is that:
Starting from the best time for the selected period, we work on increments of a tenth of a second, from that we group all the session that stands in these ranges picking the best times of every session and sum all the errors done in these sessions, after that we calculate the percentage of correct runs done for every time range.
At that point we have the 3 metrics:
- Time ranges starting from the best time every tenth of second
- Total number of errors for every time range
- Percentage of correct runs for every time range
| PB (sec) | Errors | Runs | % Correct Runs |
|---|---|---|---|
| 6.0 | 4 | 12 | 66.7% |
| 6.1 | 3 | 15 | 80.0% |
| 6.2 | 2 | 10 | 80.0% |
| 6.3 | 1 | 10 | 90.0% |
| 6.4 | 5 | 13 | 61.5% |
| 6.5 | 3 | 15 | 80.0% |
Now we have an in depth analysis of the correct runs done for every best time of the session!
See you at the next article!